Visualize compliance
Trigger agent run
Now we have applied our directive, we can trigger its application by using two approaches:
-
by using "Trigger Agent Run" straight from the webapp:
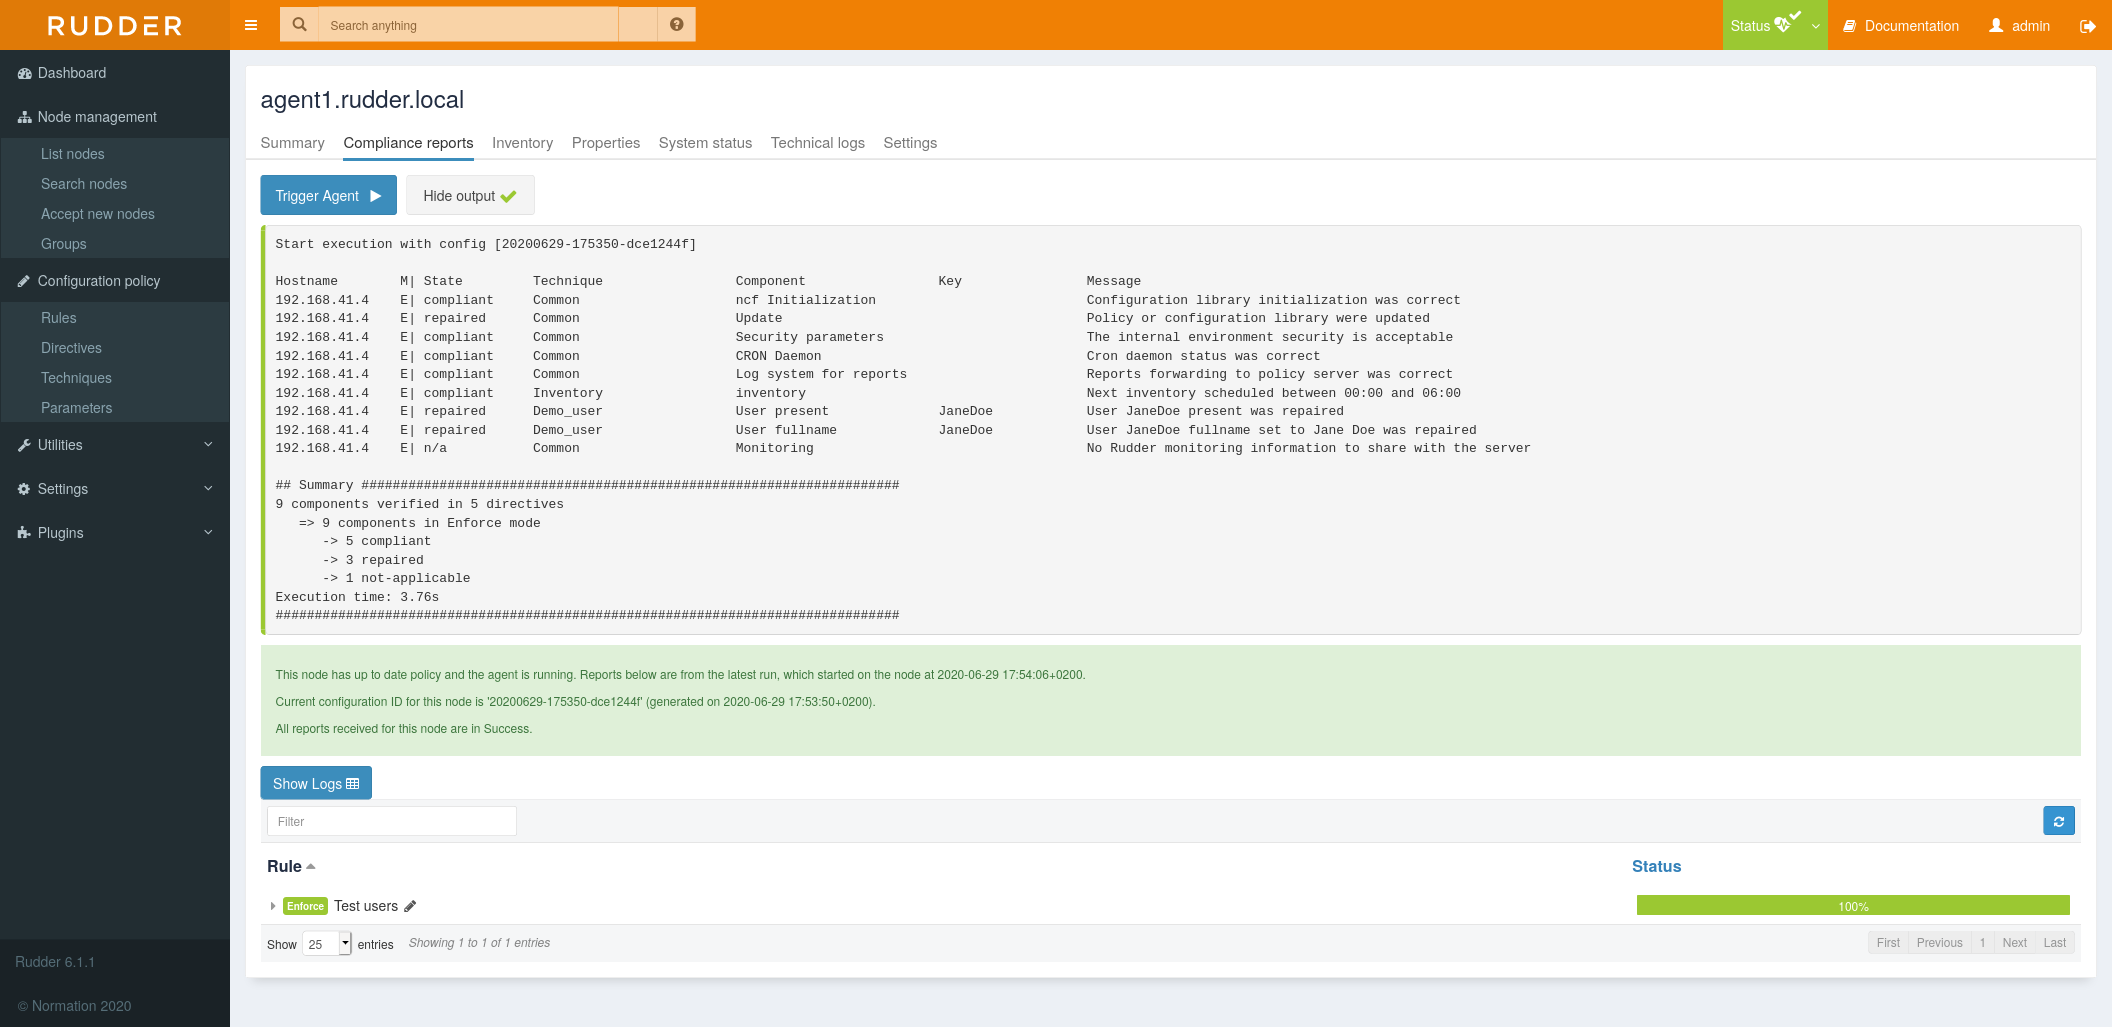
Check compliance
If it has been less than 5 min since the directive creation, the agent might have not been executed. You can click on Trigger agent to run the agent.
After some time, when the agent ran twice, you will get:
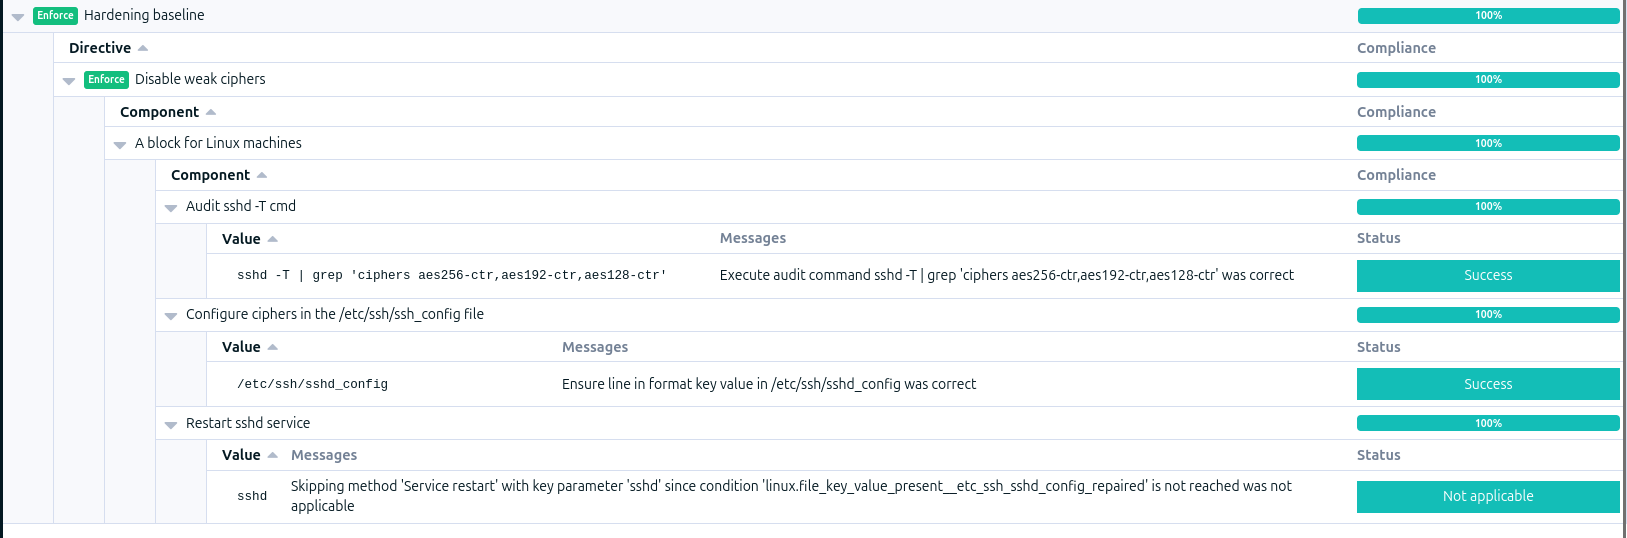
You can notice the Restart sshd service method is not applicable as the agent modified the file /etc/ssh/sshd_config on its first execution. After that, the agent won’t restart the service because the /etc/ssh/sshd_config file is not modified anymore.
-
by connecting to our node using ssh:
vagrant ssh node
And running the agent with:
rudder agent run
Rule compliance
In the first part we saw that Rudder provides a compliance view by node, which allows identifying individual problems, but this compliance view is not suited to get a general view of some policies compliance.
Rules, in addition to linking node and policies, provide a compliance entry point.
Go to Rule menu, then click on our rule Hardening baseline.
It will display a compliance page with two parts:
-
A global compliance view for the rule
-
A by-node compliance view for the rule
They allow exploring compliance differently, based on what you are looking for.
Furthermore, the Recent changes tab lists the changes done by Rudder for this rule. Click on a time slot and the details will be displayed in the table below.
Compliance is also available through Rudder API, allowing to monitor and alert over compliance levels.
← Apply a security policy Next steps →